


Audiri
Tracking and analyzing pain data for clinical use
“How can patients effectively communicate their chronic pain despite little time during the visit?”
Project overview
Scope
Audiri, an early stage startup that tracks and analyzes pain data for clinical use is founded based on this research.
Timeframe: 2 months
Team: UX researcher (Julius), UX designer (Laurens), frontend engineer, backend engineer
Methods: literature search, field visits & ethnographic interviews, design SPRINT, prototyping, usability testing.
Business problem
It can be difficult to communicate chronic pain symptoms to a doctor. One of the biggest challenges that patients experience is too little time during the doctor’s visit to really explain how they feel. Research shows that between 40-80% of chronic pain patients are misdiagnosed, resulting in serious under- and overtreatment. This project aims to build and test a solution that makes it easier for chronic pain patients to effectively communicate their symptoms and for care professionals to take pain data into account for medical decision-making.
Objectives
Understand the barriers and contributing factors to effective doctor-patient communication.
Assess the usability of the Audiri application.
Provide recommendations that address the deepest pain points.
Planning
Research methods

Discover
Secondary research: literature research
Methods
The project started with a literature search. Google Scholar and PubMed were searched to identify
1) doctor-patient communication
2) pain management applications
A first search strategy was based on Medical Subject Headings (MeSH) in the domains (i) patient, (ii) physician, (iii) communication. The second search strategy was based on the MeSH terms (i) pain management and (ii) mobile applications. Only systematic reviews in English were included in this search. In total, 3 systematic reviews were identified on doctor-patient communication and 2 on pain management applications.
Findings
Doctor-patient communication
Due to time constraints in the healthcare system, doctors spend too little time with their patients to conduct a thorough medical history.
Typical testing errors include the use of anatomical tests (CT, MRI) to detect the physiological phenomenon of pain.
Pain management applications
At this point no pain registration applications support clinician access to longitudinal pain trajectory data.
Interviews
We conducted a series of interviews to gain understanding of a variety of topics, including:
Obstacles and contributing factors to effective doctor-patient communication.
Attention given to the pain trajectory during the diagnostic process.
Methods used to assess pain.
Obstacles or contributing factors influencing the assessment of pain.
We asked the participants to show us examples of their communication.
The entire team participated during the interviews. On a weekly basis we discussed what we’ve learned.
Amount
5
Chronic patients
2
GP’s
1
Psychologist

Define
Affinity diagram
As a team, we analyzed and discussed what we thought was important, based on the research questions. We then categorized and grouped the data, and assigned codes to it. Lastly, we derived underlying themes from our codes.
After discovering themes across multiple interviews, we synthesized the data and discussed the impact of the insights. The first low fidelity designs were based on those insights.
“It’s dehumanizing when you’re asked if you’re sure it isn’t all in your head”
“For me effective communication is bringing together both my past and my future”


Findings
It’s complicated for patients to navigate their way through a fragmented care system of separate disciplines. Symptoms all interact with each other, but specialists’ don’t.
There is too little time for patients to tell their story in its rightful context. A consultation takes on average 10-15 minutes.
Our healthcare system is too focused on anatomical tests, and too little on just listening.

Experience Mapping
We broke down every step that a doctor’s appointment involves. From preparing for the consultation and making the appointment to coming back home.
After discovering similar experiences across multiple interviews, we discussed and agreed on the moments that matter. These moments that matter were used as starting points for the first designs.
Develop
Having generated several potential design direction, we’ve selected the best ones. Through wireframing we tested these ideas before writing code.
Sketching/wireframing

Deliver
Usability Test
Methods
Participants completed the tasks in the prototype using their own computers.
After the completion of the tasks, participants rated the interface on a 5-point Likert Scale with measures ranging from Strongly Disagree to Strongly Agree.
Participants also rated the application overall by using the System Usability Scale (SUS) questionnaire.
Tasks
You have an appointment next week with your orthopedist and she has invited you to use Audiri to prepare for the appointment. In order to do so, complete the following tasks:
Create an account at audirihealth.com.
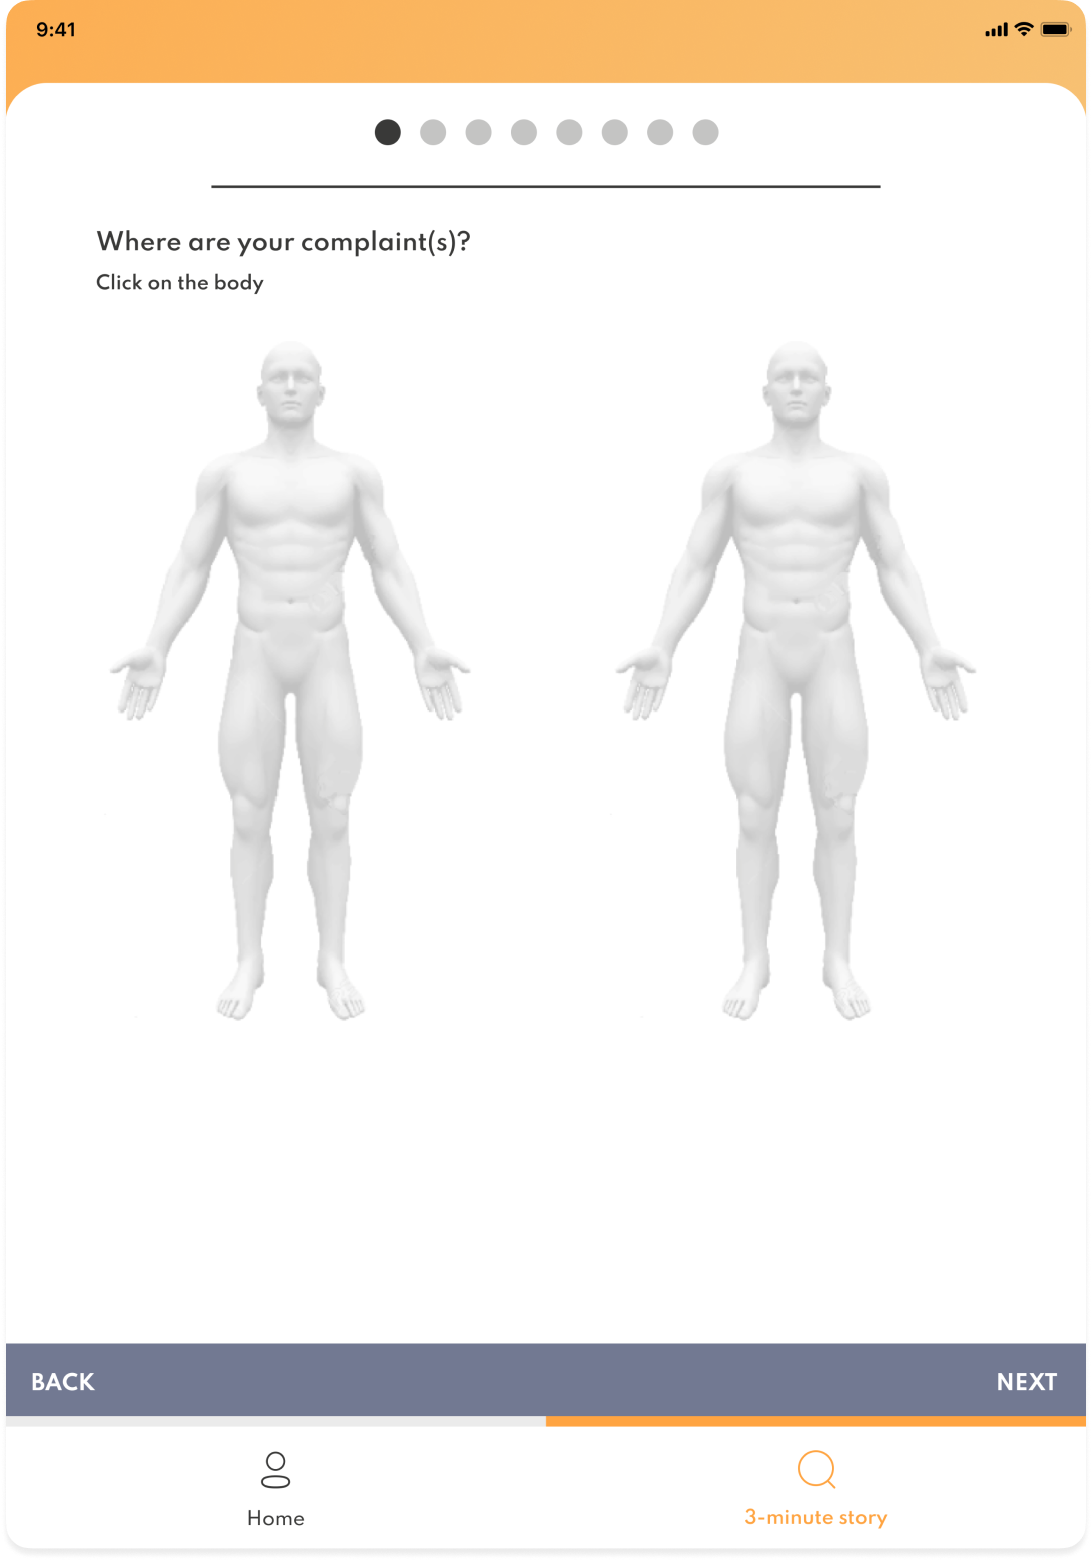
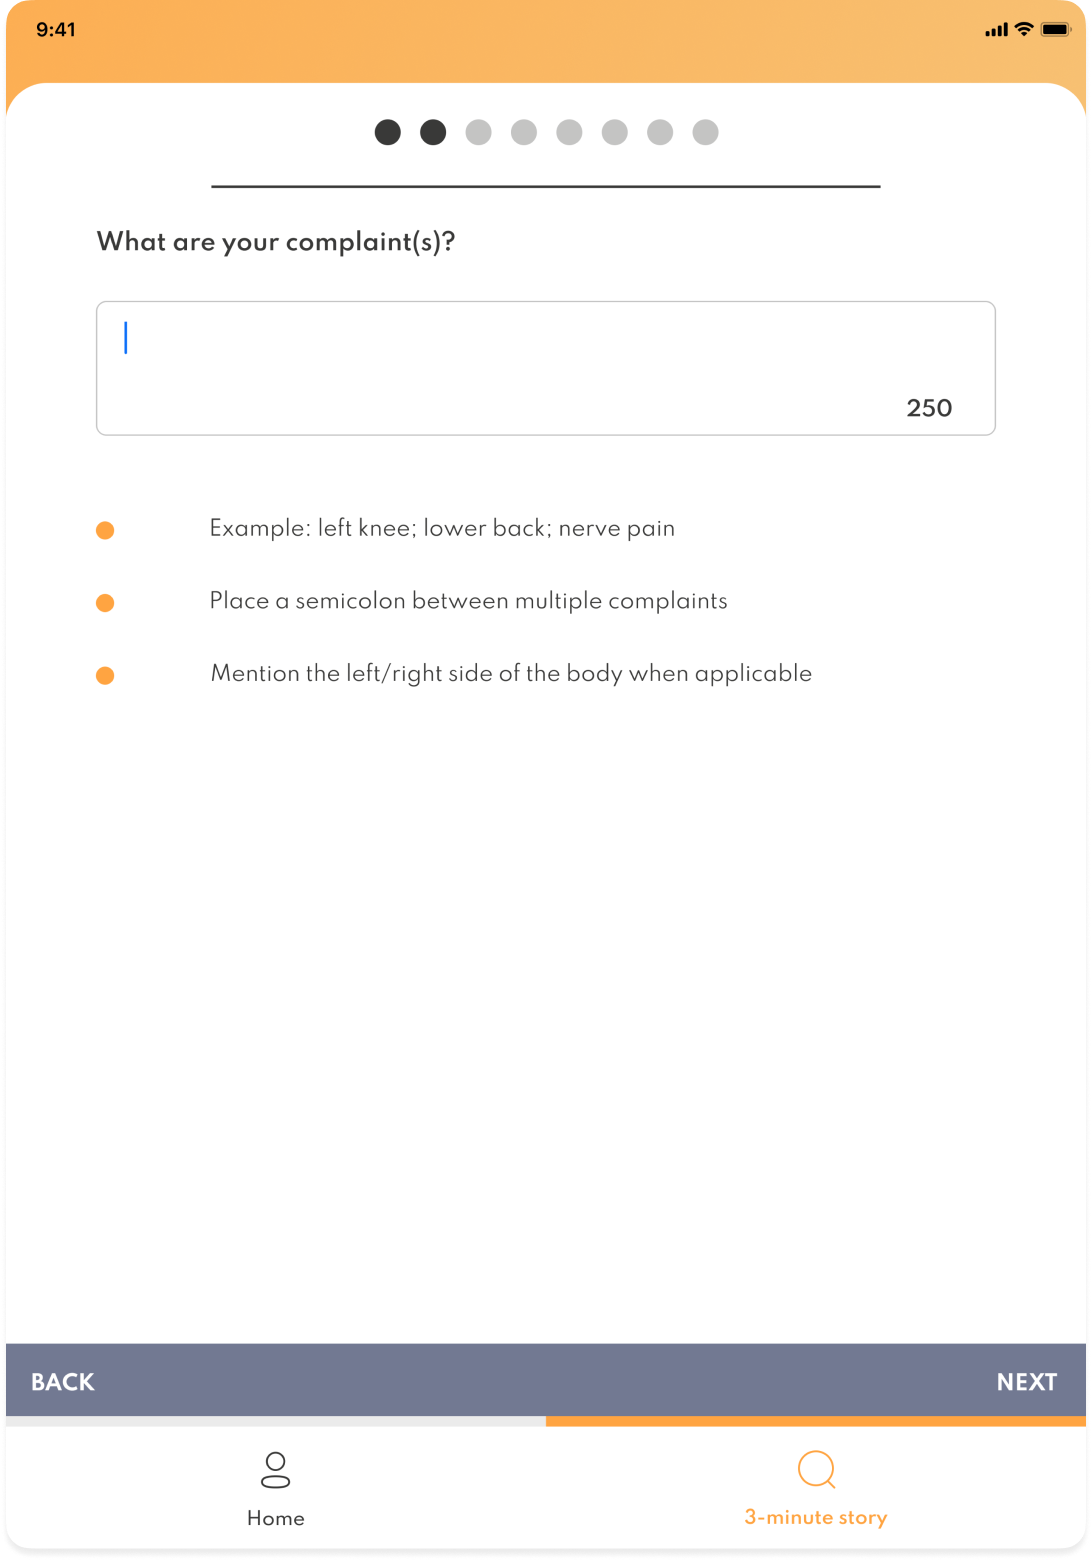
Now create a pain profile by going through the pain assessment.
After you have created a pain profile, create a report to bring to your doctor’s appointment.
Amount
6
Chronic patients
3
GP’s
Findings
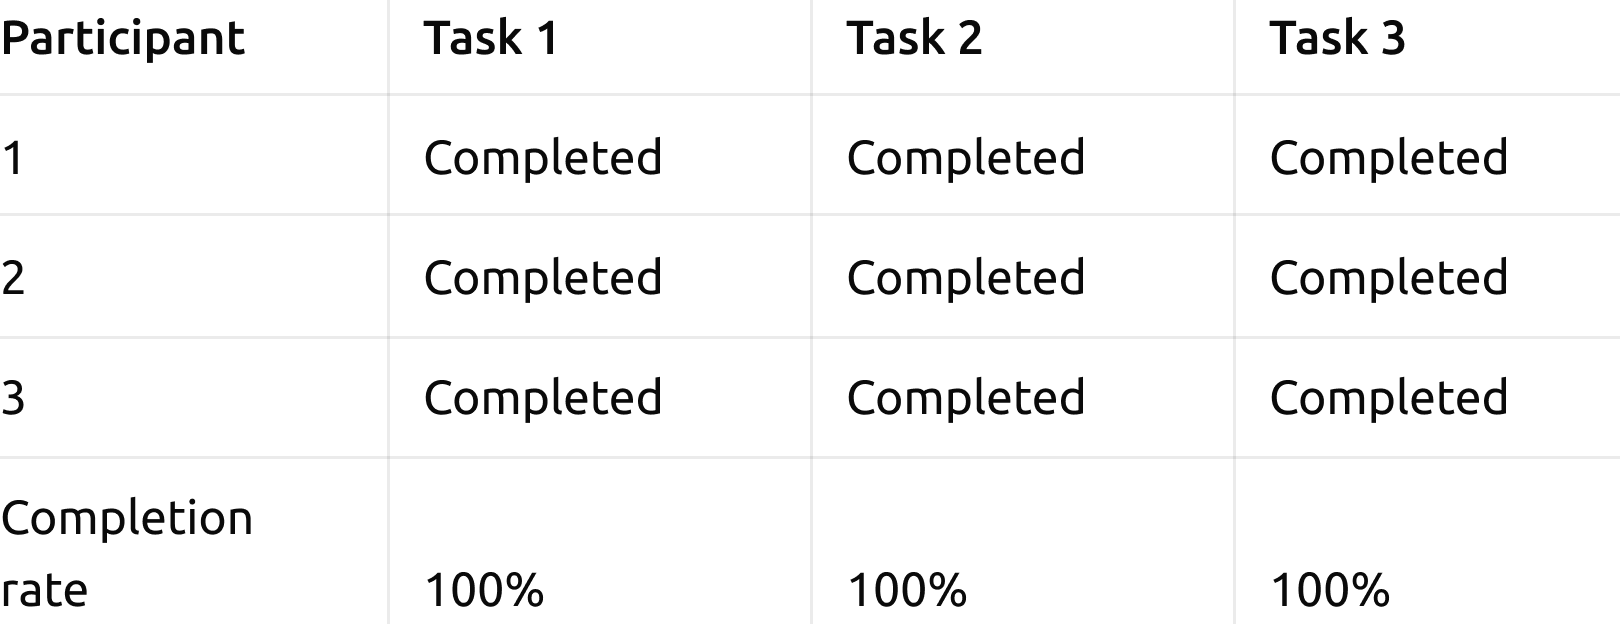
Task Completion Rate: 100%
Per Task Satisfaction: 4.9
The average SUS score was: 70.3
Users emphasized the benefit of an overview of their pain trajectory, over time.
Users struggled most with the report, which can only be created as a single point in time.
Metrics
Task completion rates
We measured task completion for each task.
Per Task Satisfaction
For each task, we measured the satisfaction of the user, using the 7-point Likert Scale Single Ease Question (SEQ).

Overall Satisfaction
The user was asked to complete the System Usability Scale (SUS) questionnaire. In that way we were able to better understand the overall system quality.

Design improvements
We prioritized usability problems based on the impact of the problem, how many people it affects, and how persistent the problems are. Based on these criteria, two problems were considered critical:
The report is a snapshot instead of summary of longitudinal data.
The application does not connect to EMR/PGO systems.
Design change based on the prioritized usability problems
We’re redesigning the report into a summary of a manually selected timeframe.
This was an important insight for the development of Audiri’s business strategy.
Reflections
A limitation of this research was the small sample size, which reduces the significance of the insights gathered. In addition, because of our limited time, the usability test included just a few tasks.
Design Challenge
Our research showed that patients don’t want to interrupt their doctors. That makes it hard to express complex symptoms when there are serious time constraints. For that reason we framed the report as a brief narrative that—when structured well—doesn’t require a lot of time to communicate effectively.
Industry take-away
The focus on somatic treatment, including diagnostic imaging, is being incentivized by the fee-for-service payment model, in which providers are rewarded for volume. Even though value-based payment is on the rise, the value added by the app could go against the financial structure of the care system.
Personal take-away
The research population was a well-defined group that suffers negative experiences. It’s hard to take the perspective of chronic pain patients when you don’t suffer chronic pain. To create a better understanding we included someone with chronic pain as part of the research and design team.